VISUALIZATION GALLERY
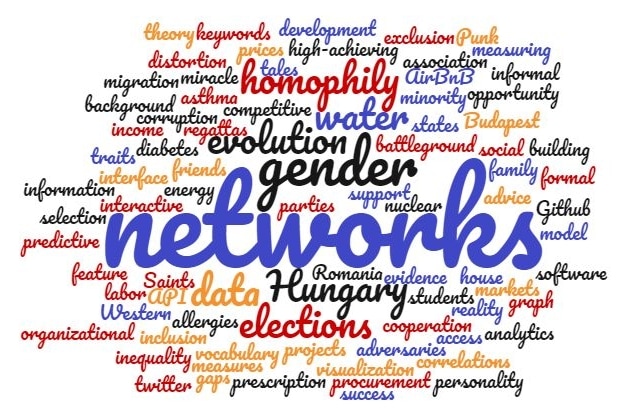
Wordcloud of the 4th Edition's Contributions
Speakers' presentations
Benjamin Lind - Data Stories - From Complex Academic Projects to Primary Education
Michael Szell - Hubcab - A Data Story on Taxi Sharing
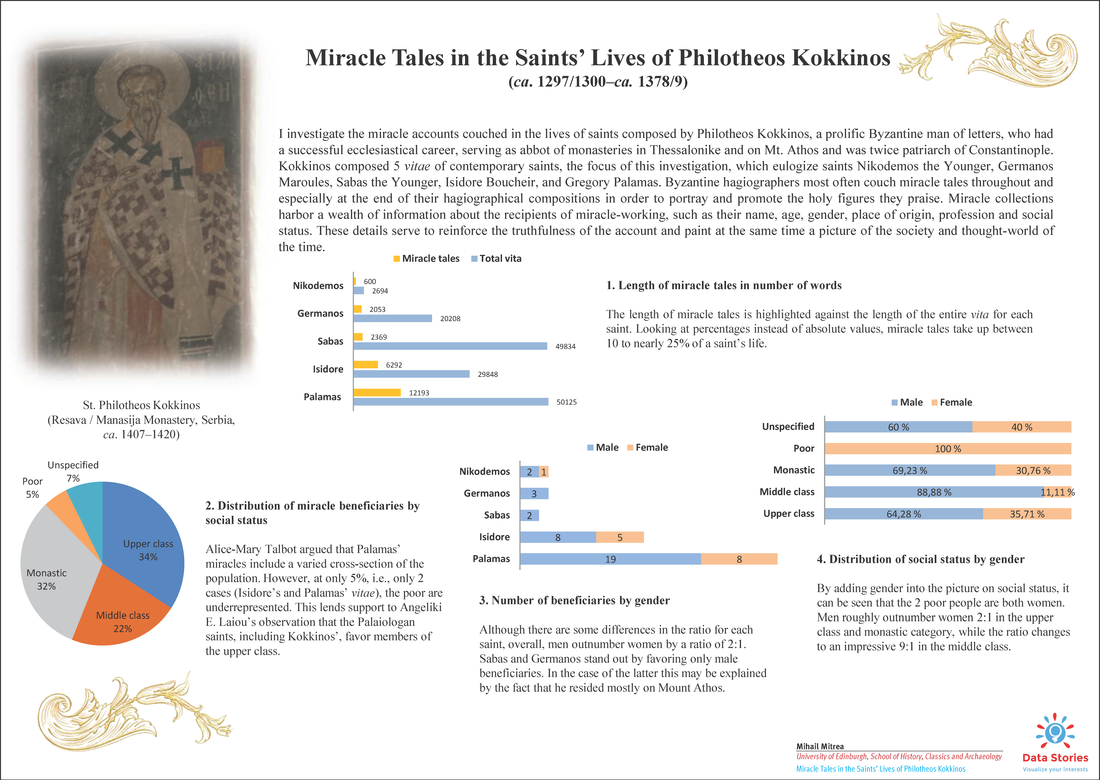
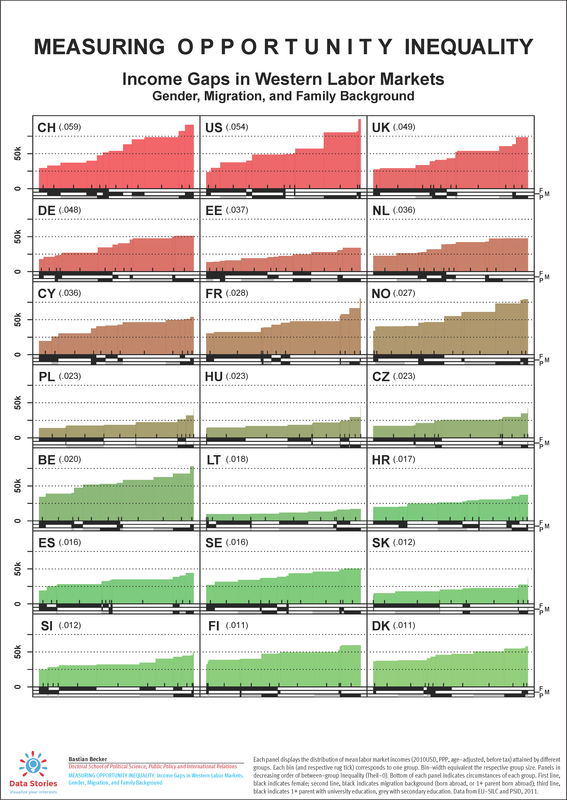
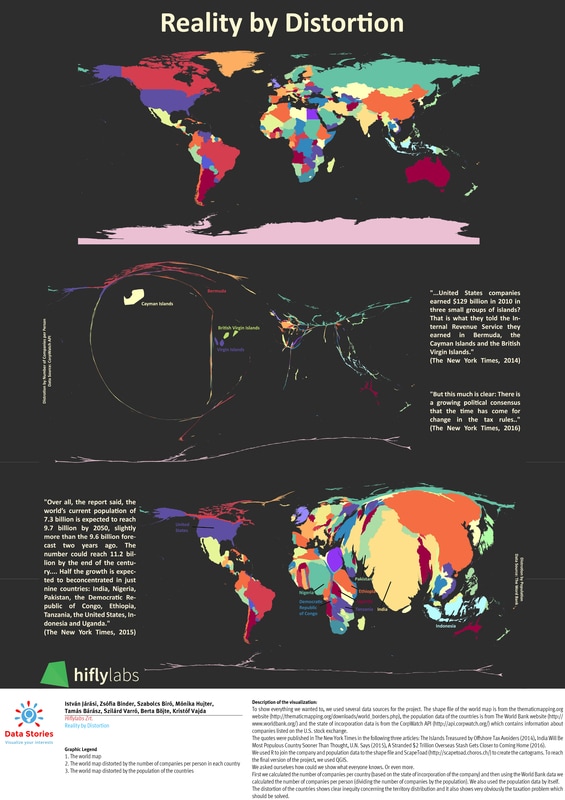
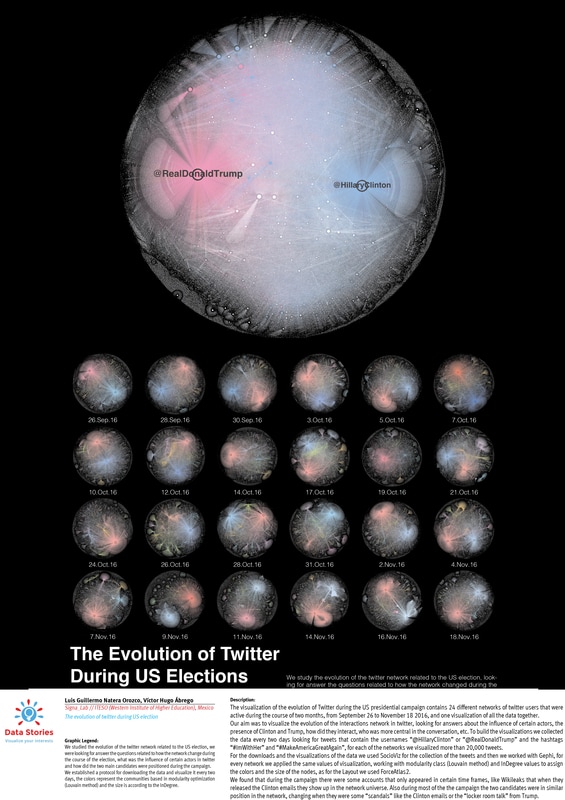
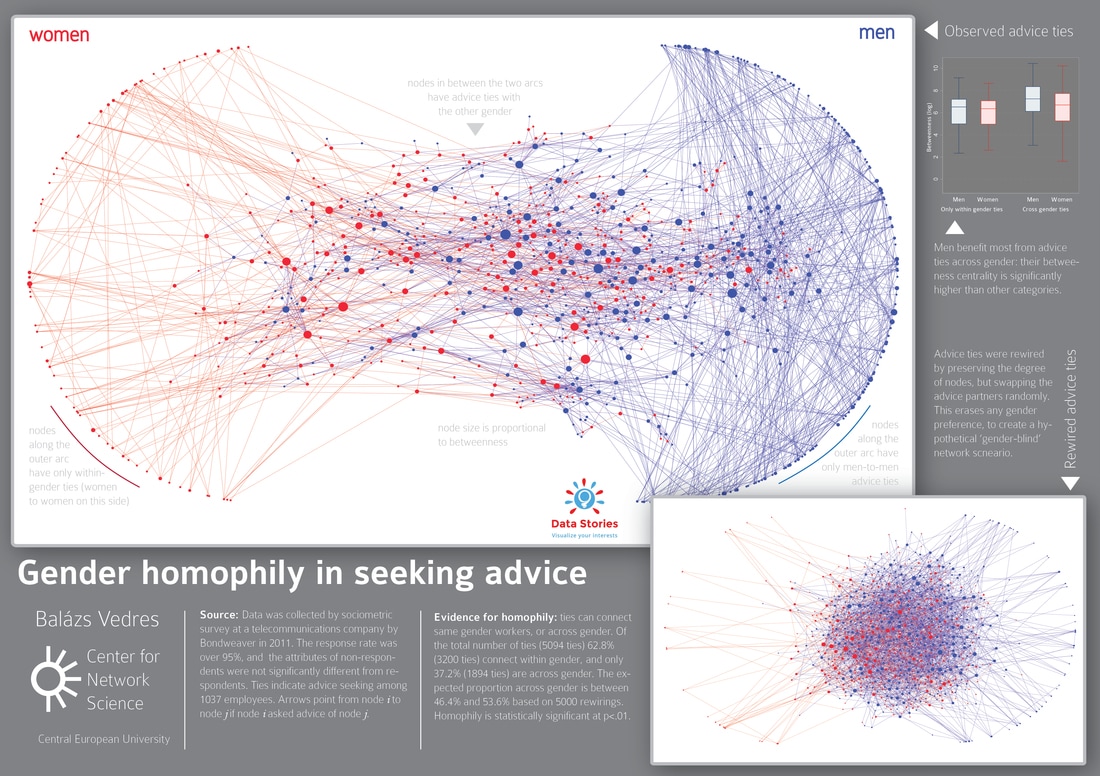
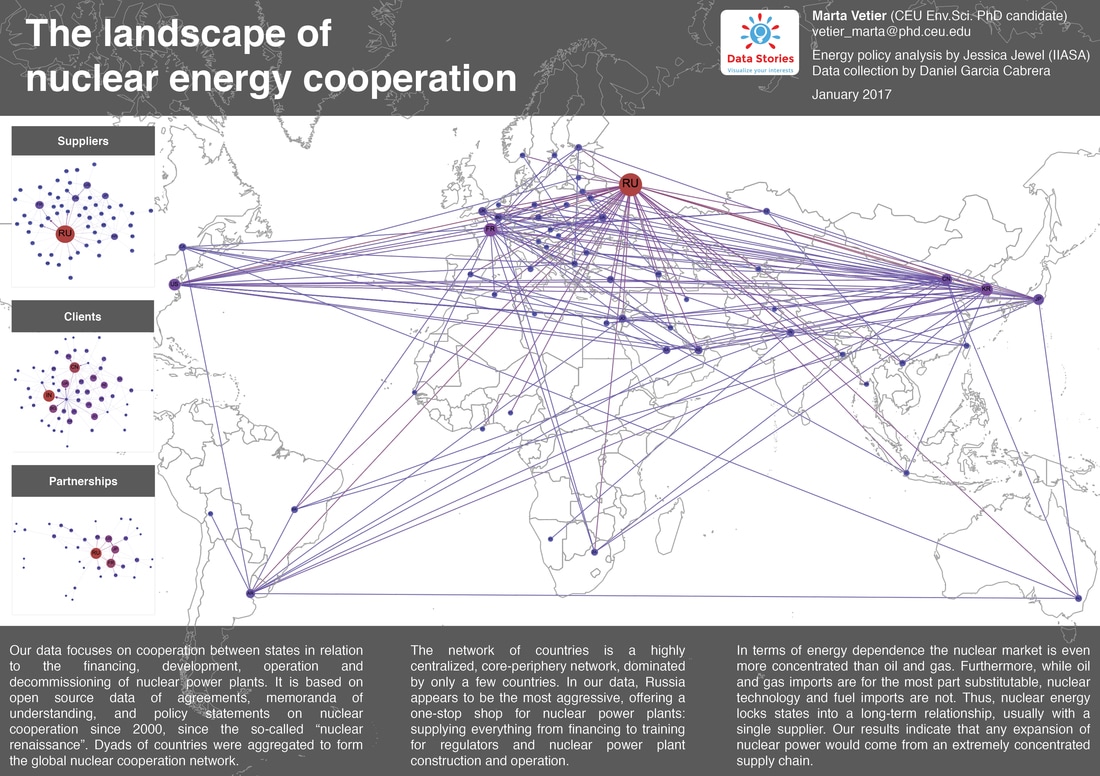
Print Visualizations
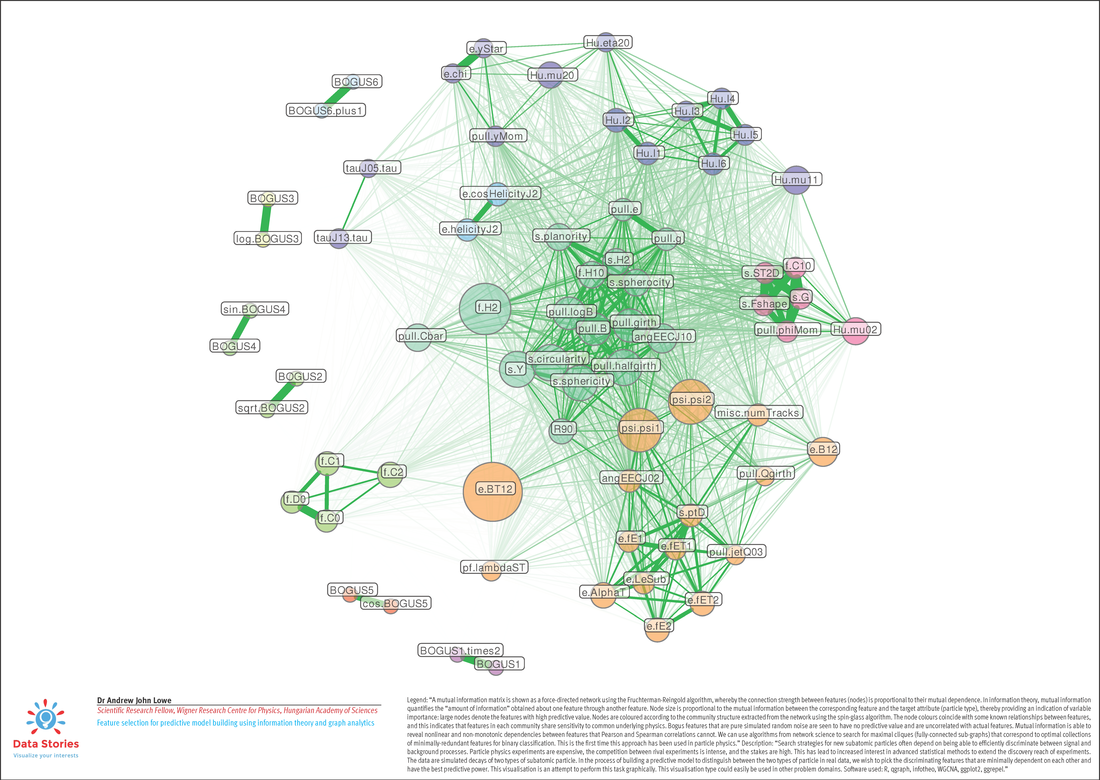
Interactive Visualizations
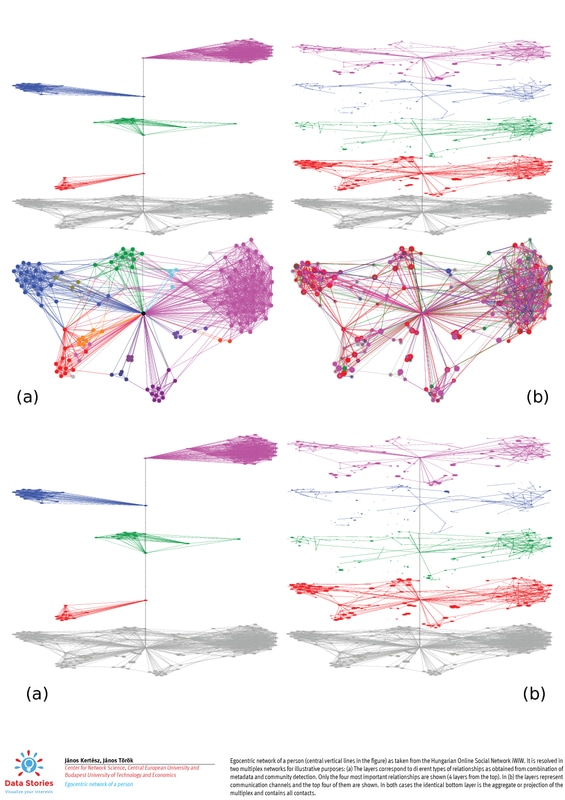
High-Achieving Minority Students Can Have More Friends and Fewer Adversaries. Evidence from Hungary
Krisztina Szűcs, Tamás Hajdu, Gábor Kertesi, and Gábor Kézdi Institute of Economics, Center for Economic and Regional Studies of the Hungarian Academy of Sciences; Department of Economics, Central European University |
Support for the Main Parties in Romania (Jan, 2015 - Dec, 2016) Endre Borbáth European University Institute |
Network of Regattas Sandor Lederer, Borbála Tóth and Krisztina Vámos K-Monitor |
The Shrinking Battleground. Repercussions of the Decrease in Number of Competitive States in the U.S. Presidential elections Tatiana Rogovich and Ivan Timofeev Doctoral School of Political Science, Public Policy and International Relations; Department of Economics |
Budapest Airbnb Data Visualization Árpád Knap Survey Statistics, Eötvös Loránd University |
Creating ad-hoc association networks of keywords of articles published in the New York Times
Júlia Perczel and Dávid Deritei Center for Network Science, Central European University |
3D Visualizations
UK House Prices
Phil Jones and Andrew Dudfield UK Data Service |
Prescriptions in Northern England: Diabetes, Asthma and Allergies
Barry Bullas, Rob Dymond-Green, Diego Perez Ruiz, Reka Solymosi, Richard Wiseman UK Data Service |